U.S. spot Bitcoin ETFs fully recouped October's outflows over the last three trading sessions, yet Bitcoin's price didn't reflect it. Yesterday the funds attracted $524.8 million — the third consecutive day of inflows and about $1.07 billion for the series. Before last Friday, roughly $615 million was spent per month; now in October the ETFs are about $460 million in the black. Recall that Monday's $526.7 million inflow was the best day since September 22 and was entirely due to IBIT from BlackRock. Over the prior two weeks, the funds lost about $910 million, so the reversal looks sharp.
Buyers' return coincided with a traditional finance argument. J.P. Morgan Asset Management published, for the first time, a long-term Bitcoin forecast this week, assuming an average annual return of 10% over a 10–15 year horizon with volatility around 55%. Notably, even that estimate sounds moderate—it doesn't promise multiples; it merely recognizes the asset as part of long-term portfolios.
Meanwhile, the price is moving the other way. On Thursday Bitcoin traded near $81,470, down 2.4% on the day, though it remains up about 2% for the week. A day earlier, it climbed to a weekly high near $85,000. Ether fell 2.6% to roughly $2,393, and total market capitalization dropped 2.9% to $2.84 trillion. Among the largest coins, Zcash fell hardest, down 5.6%, though it is still up nearly 14% for the week. The explanation lies outside ETFs: oil above $110, weak equities, and anticipation of the Federal Reserve meeting on October 27–28 — where another rate hike remains on the table due to persistent inflation — weigh on all risk assets. The takeaway: ETF inflows create a floor but do not negate the macro impulse.
Ether ETFs finally got a breather. Funds attracted $14.9 million on Wednesday, ending a five-day outflow streak that removed about $389 million. But October remains deeply negative for them — roughly -$1.07 billion — while cumulative inflows stand at $12.8 billion. The divergence between Bitcoin and Ether in ETFs remains noticeable, and this isn't the first week with such a gap.
I believe ETF inflows will be the main argument against a deep crash, and I allow for a move to $80,900, followed by a range hold until the Fed decision. A sustained push to $85,000 is possible only if inflows persist while oil eases.
On Bitcoin
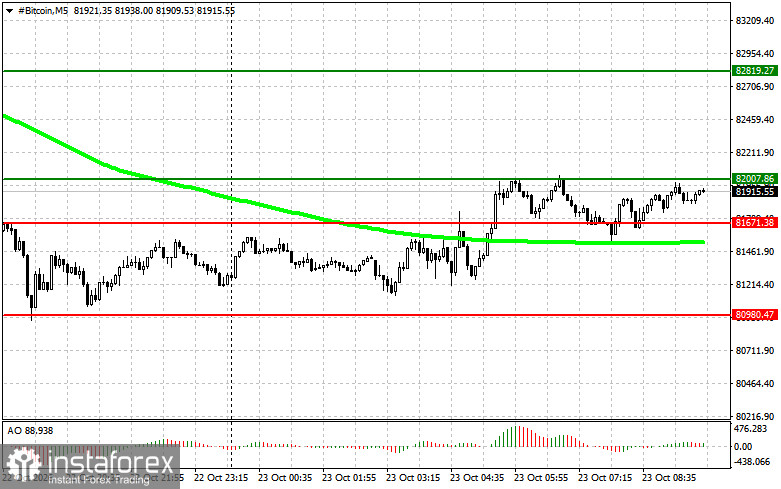
The price is near 81,800, in a range between support at 81,600 and resistance at 82,000, with outer reference points at 80,900 below and 82,800 above, so the plan is built around two mirrored directions, each with a breakout and a bounce scenario. I consider buying in two cases. If price breaks 82,000 to the upside and holds above it, I buy with a target of 82,800, provided price remains above the 50-day moving average and the Awesome Oscillator is above zero; at the target, I take profit and consider a short on the pullback. If the break of 81,600 to the downside is not confirmed and the price returns above, I buy the bounce with an initial target of 82,000 and then 82,800.
I structure selling symmetrically. If price breaks 81,600 to the downside and holds below it, I open a short position with a target of 80,900, provided the moving average is above price, and the Awesome Oscillator is below zero. If the break of 82,000 to the upside isn't confirmed and price returns below, I sell the bounce with an initial target of 81,600, then 80,900.
On Ether
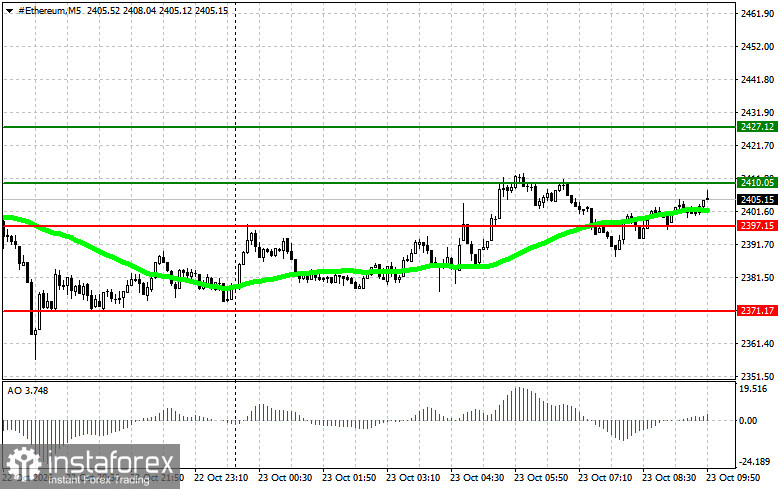
The logic fully mirrors Bitcoin on its own price scale. The range lies between support at 2,397 and resistance at 2,410, with outer reference points at 2,371 below and 2,427 above. I buy a break of 2,410 to the upside with a hold above it and a target of 2,427, provided the price is above the 50-day moving average and the Awesome Oscillator is above zero. If the break of 2,397 to the downside isn't confirmed and price returns above, I buy the bounce with an initial target of 2,410, then 2,427.
I sell a break of 2,397 to the downside with a hold below it and a target of 2,371, provided the moving average is above the price and the Awesome Oscillator is below zero. If the break of 2,410 to the upside isn't confirmed and price returns below, I sell the bounce with an initial target of 2,397, then 2,371. Both indicators remain filters to cut off false moves rather than standalone reasons to enter early, and the decision is made only after the price actually confirms the specified levels.