empty
 
 
23.10.2026 10:03 AM
Gold on October 23: Dominance of Selling Forces.

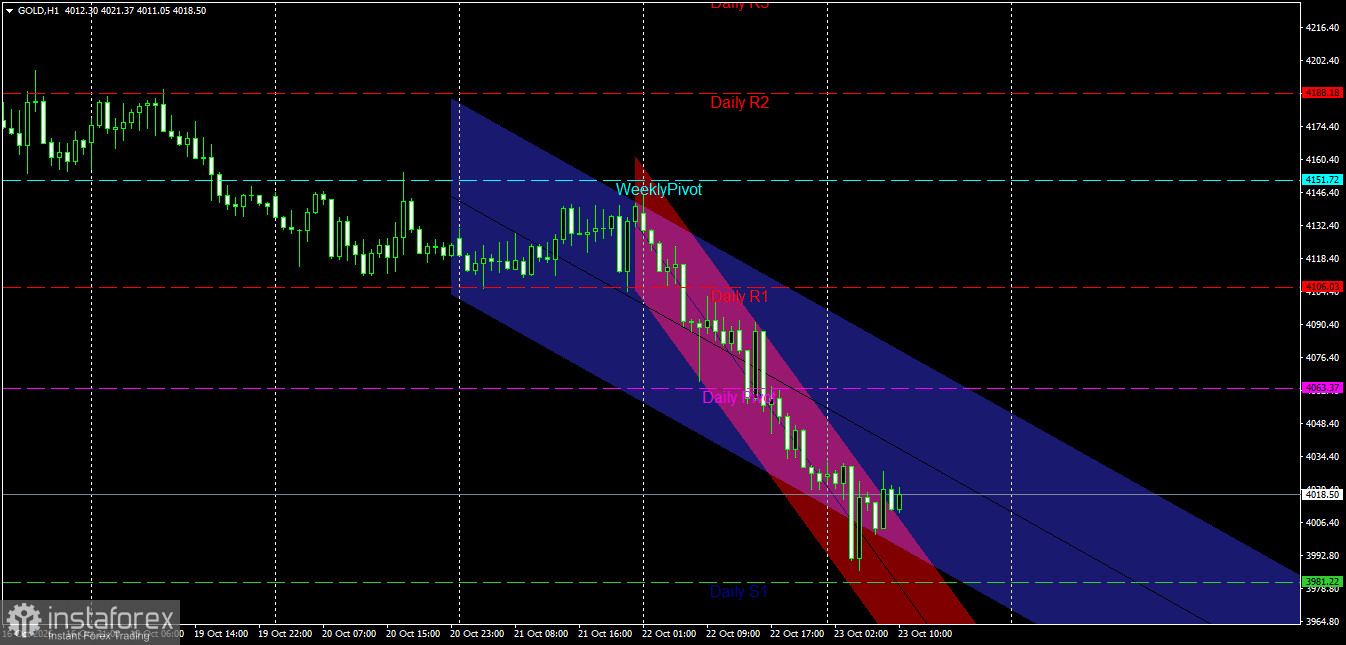
The one-hour (H1) chart for Gold (GOLD) reveals a sharp, aggressive bearish trend, with the downward momentum accelerating. Currently trading at 4018.50, the price has sustained a continuous decline, breaking through several key technical support levels and vital pivot points—a clear indication that selling pressure dominates and the "bears" are in control of the short-term market movement.

Technical Analysis and Price Action

This image is no longer relevant

Price Channel Structure: The price is moving within a broad, primary descending channel (in blue), which reflects the overall negative trend. Overlaid on this is a steeper, secondary descending channel (in pink), which exerts direct downward pressure, driving the price toward a succession of new lows. Notably, the price is currently positioned near the lower boundaries of these channels, with minor fluctuations suggesting an attempt to establish a temporary support base around current levels.

Interaction with Pivot Points and Resistance: The price faced early downward pressure after failing to hold above key pivot levels—specifically the weekly pivot at 4151.72—as well as the daily resistance levels (Daily R1 and Daily R2). Consequently, the price broke through the daily pivot lines and is now trading below critical support levels, heading toward the first daily support level (Daily S1), located near 3981.22. Pivotal Support and Resistance Levels

Key Resistance Levels:

First Resistance: 4063.37 (previous daily pivot level and nearby reversal zones).

Second Resistance: 4106.03 (Daily R1 resistance level).

Pivotal Resistance: 4151.72 (Weekly Pivot point and the threshold for trend direction).

Key Support Levels:

First Support: 4000.00 (psychological barrier and the intraday focal point for trading).

Second Support: 3981.22 (Daily S1 support level).

Major Support: The 3950.00 zone and below, should the price decline continue.

Price Action Outlook and Trading Recommendations

Bearish Scenario (Primary):

A negative trend remains dominant and most likely, provided the price stays below the immediate resistance levels and the weekly pivot point.

Recommendation: It is advisable to sell into any corrective upward rebounds toward the 4040.00 – 4063.37 range, as long as these levels continue to cap any price advances.

Technical Targets: Aim for the psychological support level at 4000.00, with a potential extension toward the first daily support at 3981.22.

Corrective Bullish Scenario (Alternative):

This scenario would be triggered if significant buying pressure emerges, successfully lifting prices from current lows and breaking through the technical resistance levels. Confirmation Condition: A one-hour candle must close clearly above the 4063.37 level.

Technical Targets: This would pave the way for a deeper bullish correction, targeting the 4106.03 level, followed by a move toward the weekly pivot at 4151.72.

Risk Management

During periods of sharp declines and high negative momentum, avoid entering trades indiscriminately. It is essential to strictly adhere to rigorous capital management rules, limiting risk to a maximum of 2% per trade. Furthermore, ensure that stop-loss orders are placed with precision to protect your portfolio against sudden reversals and the inherent volatility of the gold markets.

Price Action on the Daily Gold Chart:

This image is no longer relevant

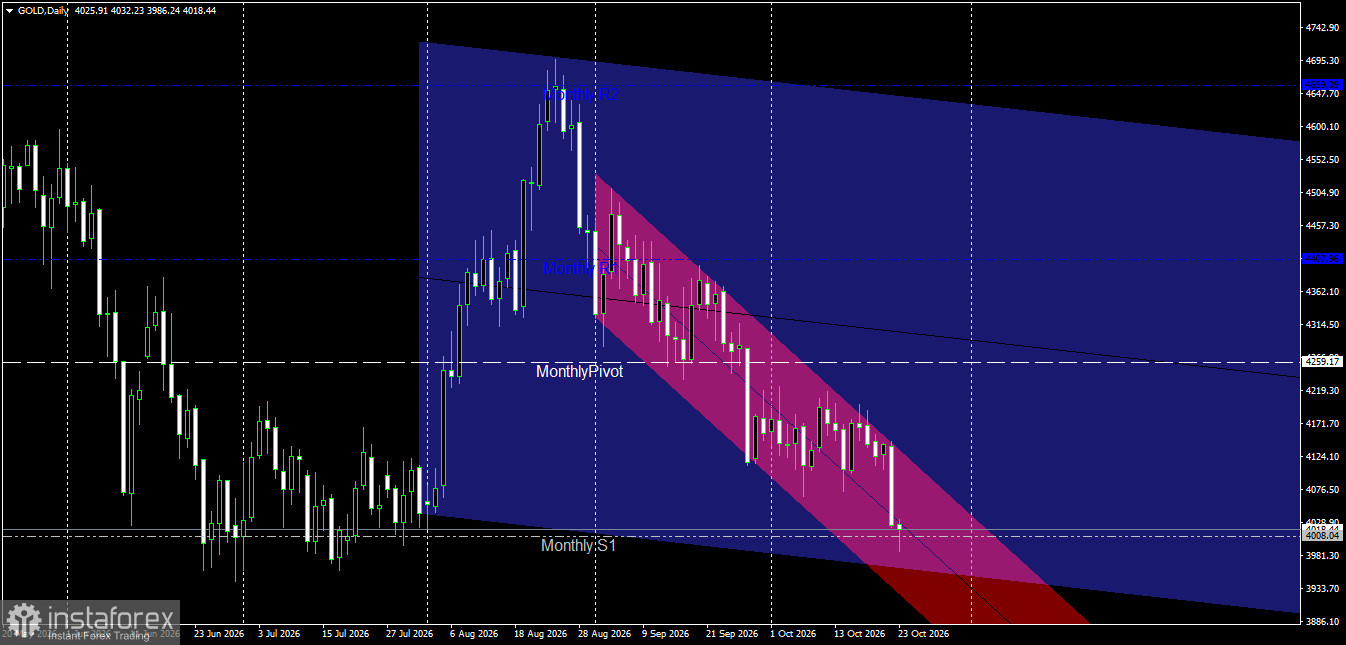
The price is currently trading at 4018.44 within a descending channel on the daily timeframe. It has registered a sharp decline, reflecting persistent, intense selling pressure and remaining below key pivot levels.

Analysis of Today's Candle: The current daily candle indicates total control by the bears (sellers), who are aiming to test psychological support levels and approach the lower boundary of the descending channel, as well as the first monthly support level at 4008.04.

Outlook for Future Movement:

Bearish Scenario (Primary): This remains highly probable as long as the price stays below the monthly pivot point and nearby resistance levels. There is a potential for the price to break through the 4000.00 mark, targeting deeper support levels.

Bullish Scenario (Alternative): This would require the emergence of significant buying pressure, leading to an upward corrective rebound and a successful stabilization above nearby resistance levels, potentially shifting the price back toward a sideways (ranging) pattern.

Nermin Ezzeldin,
انسٹافاریکس کا تجزیاتی ماہر
© 2007-2026
انسٹافاریکس کے ساتھ کرپٹو کرنسی کی معاملاتی تبدیلیوں سے کمائیں۔
میٹا ٹریڈر 4 ڈاؤن لوڈ کریں اور اپنی پہلی ٹریڈ کھولیں۔
  • Grand Choice
    Contest by
    InstaForex
    InstaForex always strives to help you
    fulfill your biggest dreams.
    مقابلہ میں شامل ہوں
  • چانسی ڈیپازٹ
    اپنے اکاؤنٹ میں 3000 ڈالر جمع کروائیں اور حاصل کریں$1000 مزید!
    ہم اکتوبر قرعہ اندازی کرتے ہیں $1000چانسی ڈیپازٹ نامی مقابلہ کے تحت
    اپنے اکاؤنٹ میں 3000 ڈالر جمع کروانے پر موقع حاصل کریں - اس شرط پر پورا اُترتے ہوئے اس مقابلہ میں شرکت کریں
    مقابلہ میں شامل ہوں
  • ٹریڈ وائز، ون ڈیوائس
    کم از کم 500 ڈالر کے ساتھ اپنے اکاؤنٹ کو ٹاپ اپ کریں، مقابلے کے لیے سائن اپ کریں، اور موبائل ڈیوائسز جیتنے کا موقع حاصل کریں۔
    مقابلہ میں شامل ہوں
  • 30 فیصد بونس
    ہر بار جب آپ اپنا اکاؤنٹ ٹاپ اپ کریں تو 30 فیصد بونس حاصل کریں
    بونس حاصل کریں

تجویز کردہ مضامین

ابھی فوری بات نہیں کرسکتے ؟
اپنا سوال پوچھیں بذریعہ چیٹ.
Widget callback